Investors hunt for alternative data to track coronavirus shock
By Philip Georgiadis in London, Robin Wigglesworth in Oslo and Hudson Lockett in Hong Kong | février 18, 2020
Investors scrambling to quantify the impact of the coronavirus outbreak on China are turning to a string of unusual data points to measure disruption to the world’s second-largest economy, from food-delivery apps to the polluted air wafting over Hong Kong.
The humanitarian crisis has caused factories to be shut and cities to be closed off, and has prompted analysts to slash their first-quarter economic growth forecasts for both China and the rest of the world.
The crisis has also sparked a race among investors to gain an edge by finding esoteric sources of information that can be used to measure just how bad the economic pain in China is — and when the recovery is beginning.
Chen Mu, founder of Beijing-based research firm BigOne Lab, said the data provider was expanding the trackers it provided “because our clients, mainly institutional investors and corporates, are enquiring more about impact and recovery speed of different sectors”. Mr Chen said there was a broad consensus about a slowdown in China, “but the bigger question is how the recovery goes”.

BigOne’s insights point to slow progress in bringing businesses back online. In early February, for example, 83 per cent of about 1m restaurants tracked on Meituan-Dianping, China’s biggest delivery platform, remained closed. As of February 14, services were still suspended at 87 per cent of roughly 5,500 outlets operated by Luckin Coffee, China’s rival to Starbucks.
Airline bookings, meanwhile, suggest that the viral outbreak has caused the biggest-ever reduction in activity by a single event, including Sars and September 11 2001, according to Eagle Alpha, a Dublin-based provider of alternative data. The airline industry has lost 10m seats to, from and within China.
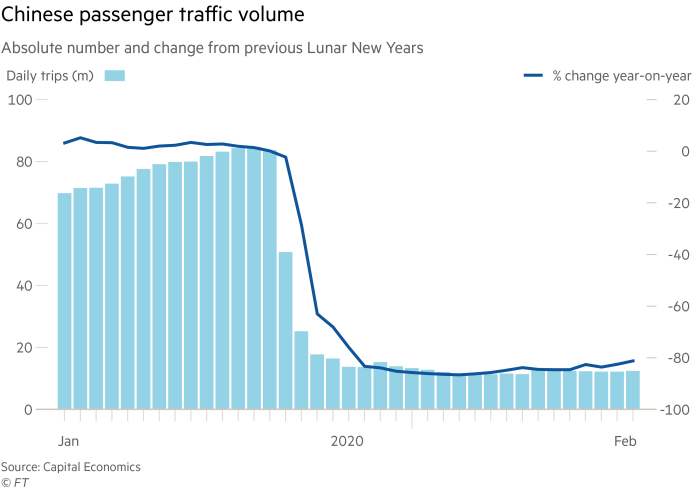
Analysts say that normal economic activity should have resumed last week after an extended lunar new year holiday. But indicators including traffic congestion rates, coal consumption and property sales are all still running well below regular levels.
“All of [the indicators] paint a very similar picture of an economy that just grinds to a halt every time around the new year, but has barely picked up at all since then,” said Gareth Leather, Asia economist at Capital Economics.
Investors have long tried to mine alternative data points for clues on the health of the Chinese economy, as some set little store in the official numbers that emerge — often after a long lag — from Beijing. Such reservations have been compounded by a near-total shutdown as the government tries to contain the spread of the disease.
Min Dai, an Asia-Pacific strategist at Morgan Stanley, told clients this month that “probably the most asked question among investors these days” was how to track the resumption of production in China.
Sitting in the bank’s offices in the 118-storey International Commerce Centre in Hong Kong, Mr Dai’s colleagues noticed that their views have been improving over the past month as mainland factories powered down. Using air pollution levels as a proxy to track the restart of industrial production, they suggested that activity could be running at 50 per cent to 80 per cent below capacity.
Goldman’s economists noted a modest rebound in some data points last week, but concluded that “in absolute levels, all indicators on the industrial and services sectors that we track remained relatively weak in the first half of February”.

Official data will confirm the clues coming from the real-time numbers, said Matt Harris, head of investment strategy at the wealth manager Hightower in New York. “We expect to start seeing weaker data in the coming weeks,” he said.
For now, said Tracy Chen, a portfolio manager at Brandywine Global Investment Management, “it is like flying in the dark”.

Sitting 7,000 miles away in Philadelphia, Ms Chen is looking for signals from the vast amount of digital data that the country produces. She has built her own dashboard using 20 reference points including traffic from the search engine Baidu, and daily figures for how many drivers are on the roads, via the satellite navigation company TomTom.
The numbers are not encouraging, she said. “It will be very ugly in the first quarter, all the data is telling me.”

© The Financial Times Limited 2020. Tous droits réservés.
Veuillez ne pas copier-coller les articles du FT pour les distribuer par courriel ou les publier sur le Web.