Monthly Market Insight - May 2022
“Four headwinds” may be shifting
There’s little doubt that 2022 has been challenging for investors. The “four headwinds” of market volatility—inflation, central banks tightening monetary policy, the war in Ukraine, and the pandemic—have applied extreme pressures on investors. There are a few recent developments that suggest we may be nearing an inflection point, however. The stock market selloff in May pushed valuations and sentiment indicators to attractive levels, and some sentiment and technical indicators are at levels typical of stock market bottoms, a good sign for a potential rebound.
The NEI perspective
Stocks stage late-May relief rally, muted returns for the month. After consecutive weeks of declines, the S&P 500 Index, Nasdaq Composite, and global equity markets experienced a moderate relief rally in the final week of May. That week, the technology-heavy NASDAQ rallied 7.3% off lows due to the strong performance of large-cap technology stocks. The S&P 500 Index closed the month up 0.72%, while the Nasdaq was fairly flat.
The BoC hikes by 50 bps, prepares to act “forcefully” if needed. On June 1, the Bank of Canada increased the overnight interest rate by 50 basis points, adopting a more forceful, hawkish tone toward moderating inflation. This moved yields upward, especially on the shorter end of the curve. Questions remain as to whether the BoC could hike rates to more restrictive levels or make other policy changes if inflation pressures continue.
As economies combat inflation, world growth in question. Global growth is expected to moderate as central banks tighten monetary policy, as economies continue to deal with inflation pressures. The IMF projects healthy growth rates in Canada (3.9%) and the U.S. (3.7%) relative to Europe (2.8%). However, some analysts believe tightening monetary policy could tip the world into a recession.
Performance (price return)
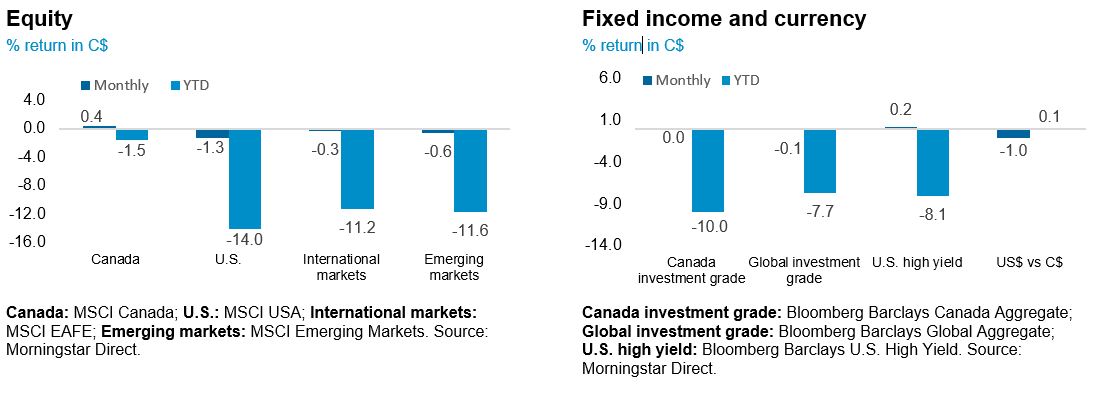
As of May 31, 2022
Staying invested is about time in the market, not timing the market
The technical definition of a bear market is a drawdown of at least 20% in a stock market index from its most recent high. The S&P 500 Index briefly entered bear market territory on May 20, 2022, before reversing course. The Nasdaq Index also entered bear market territory in recent months. Of note, while bear markets are synonymous with strongly negative sentiment around equities, it is not uncommon for the market to see significant drawdowns on its way toward generating longer-term gains.
Analyzing the history of the U.S. stock market, we see four major market bottoms prior to March 2020—1932 (Great Depression), 1974 (energy crisis), 2003 (dotcom bubble), and 2009 (Global Financial Crisis)—that resulted in protracted bear markets. On the journey toward these troughs from the prior market peak, in each case there were at least three rallies of 10% magnitude. The four bear markets leading to these market bottoms cumulatively saw 18 rallies of over 10%. In short, bear markets rallies tend to be a feature, not a defect, of equity investing.
An additional salient point is that some of the best days in equities tend to come during periods of elevated volatility, and when broader sentiment is negative. For example, in the history of the S&P 500 Index, 19 out of the 20 largest daily gains have come around bear market periods (1929–1933, 1987, 2008, 2020). Notably, these outlier days tend to cluster together and occur during periods of elevated volatility.
The key lesson from this is an old adage, that long-term investors benefit from “time in the market, and not from timing the market.” A desire to avoid the worst days also comes with missing out on the best days. Missing out on the best days in turn significantly reduces long-term returns for investors. Expecting multiple market rallies as a typical feature of bear markets and staying invested throughout the process sets up investors for considerable potential for long-term investment success. The chart below illustrates the growth over time of equity market returns, despite multiple market pullbacks.
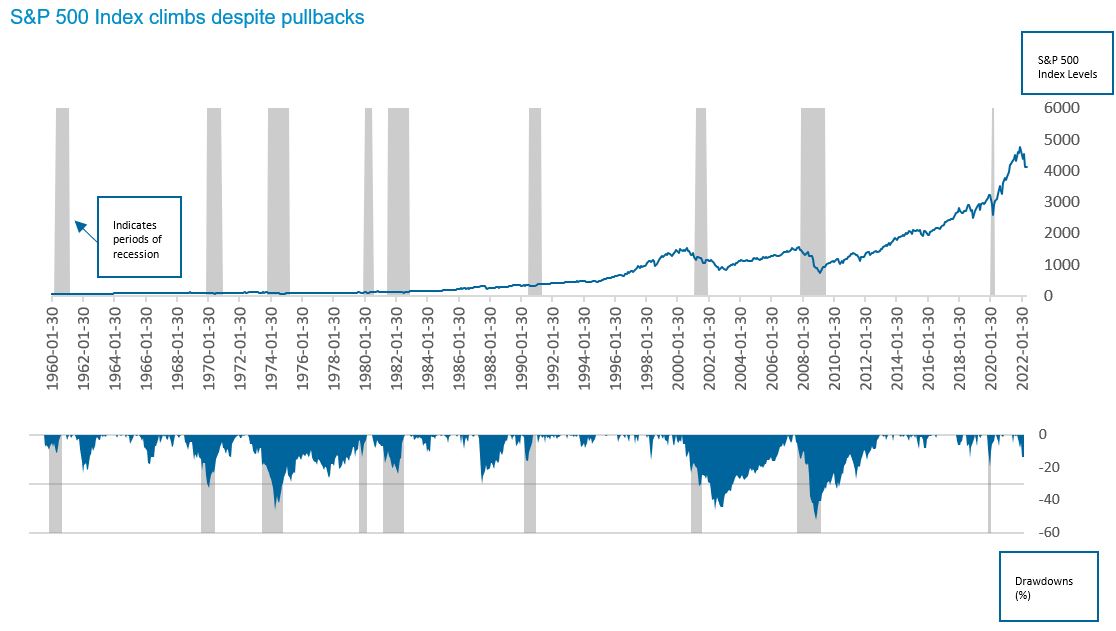
As of May 31, 2022