Monthly Market Insight - January 2024
Anticipation of rate cuts fuels risk-on sentiment
Performance across asset classes was mixed in January, following the broad-based rally in the last two months of 2023 when Jay Powell’s, Chair of the U.S. Fed, comments raised the prospects of rate cuts. In the U.S., the S&P 500 Index was propelled to record highs as optimism around a potential soft-landing scenario fuelled the continued rally in the mega cap stocks. Meanwhile, good news was bad news on the fixed income side with strong economic data pushing yields higher in mid-January, before settling back down by the end of the month. U.S. 10-yr yields had minimal change at 3.9% by the end of January. Global bonds returned -0.2%, while Canadian bonds returned -1.5% for the month.
While the S&P 500 returned 2.9% in January, Japan’s TOPIX Index was the best performing equity market, up 6.0% for the month, continuing the strong performance seen last year. The S&P/TSX Composite Index posted a small gain of 0.5%, while emerging market equities were down -3.3%, driven by continuing concerns about China.
Conflict and political uncertainty
From a geopolitical standpoint, the start of 2024 has been bleak – conflicts in the Middle East continue to rage on, with an increasing probability that more countries will become directly involved. The additional conflict in the Red Sea has threatened the global supply chain, as this stretch of water is crucial for trade between Asia, Europe and Africa. Although the situation continues to escalate, the impact on the markets has been muted this far.
In addition, there are concerns that major elections around the world could result in more geopolitical uncertainty in 2024, with the presidential election in the U.S. expected to cause the most market volatility.
However, looking at the U.S. market’s historical behavior in election years going back to 1932, the S&P 500 index typically delivers positive performance for the year, with greater volatility and lower performance in the first half, which then usually turns around in the second half of the year when there is better visibility into who the next president will be.
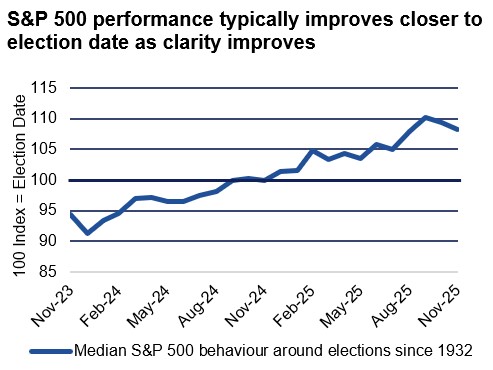
Source: Bloomberg, NEI Investments
Bottomline: Over the long term, the party affiliation of the U.S. president has had almost no impact on stock returns. Rather than political outcome, indices are mostly driven by the growth prospects and expectations of their underlying companies. Investors should rather focus on identifying companies that can deliver long term growth, while commanding a reasonable price.
Wall of cash
With GIC rates rising along with short term rates, inflows into short term GICs and money market instruments have skyrocketed, reaching an unprecedented level of around U.S.$6Trillion. This trend may start to reverse shortly, as short-term yields are expected to decline along with policy rate cuts, at which point investors who have been on the sidelines are likely to start reinvesting the money into risk assets.
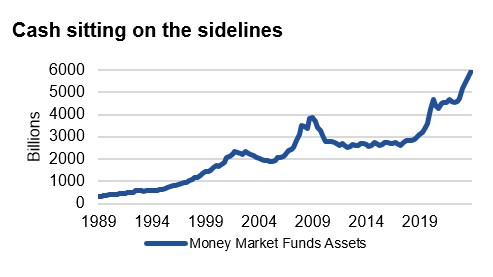
Source: Bloomberg, NEI Investments
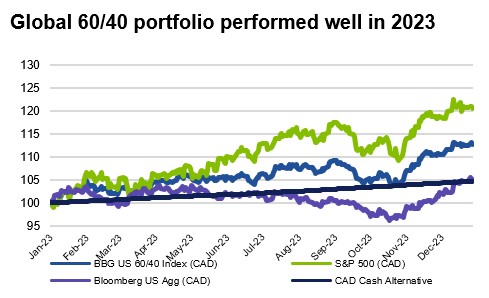
Sitting on the sidelines has also been costly. The traditional 60/40 portfolio also performed well in 2023, gaining strong positive returns as companies delivered earnings growth at expanding margins beyond market expectations. The opportunity cost investors faced sitting on the sidelines was tremendous.
Bottomline: As short-term rates fall, money market instruments will become increasingly less attractive compared to fixed income and equity investments. This may push investors to get off the sidelines and to redeploy capital back in the markets, which may provide a strong technical boost to drive markets higher.
Source: Bloomberg, NEI Investments
Path of rates drives market direction
With the continued uncertainty about the forward path for inflation and policy rates, the yield volatility has continued, and has also remained a key driver of the markets.
Resilience in U.S. economy pushing yields higher
U.S. 10-year treasury bond yields have been volatile over the last few months, peaking at just under 5.0% on October 19th, then fell back to a bottom of 3.8% on December 27th, before rebounding back to 4.0% on January 30th.
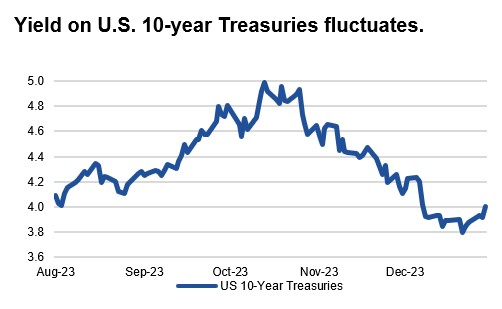
Source: Bloomberg, NEI Investments
We saw a sharp drop in yields in November after dovish Fed comments suggesting that we may have seen the end of rate hikes and rate cuts can be considered at some point. This was the welcoming news that spurred a market rally across equities and fixed income assets in the last two months of 2023.
Yields rebounded in early January, as the latest inflation data was slightly higher than expected. In addition, several recent data releases also pointed to the ongoing resilience of the U.S. economy underpinned by a strong consumer spending in retail sales, reducing the confidence level that inflation is firmly under control. The latest CPI data in the U.S. came in slightly above expectations driven by a rise in shelter costs and vehicle prices while other core CPI components continue to show moderation and more subdued price movements.
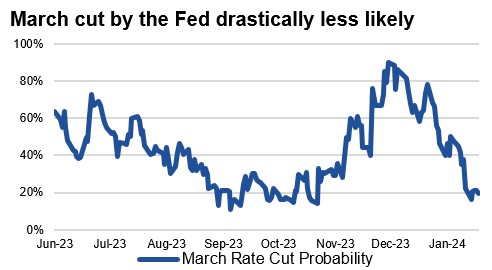
In January, the Fed left its key policy rate unchanged, and has pushed back on dovish market speculation for rate cuts starting in March. The result is a market repricing via bond futures of a probability of a Fed rate cut in March going from a high of over 80% to current level at under 20%. That is still too optimistic compared to the Fed’s forecasts, as it is projecting only three rates cuts in 2024 to a policy rate of 4.625% at the end of 2024, while the market is still pricing in six rate cuts and expecting rates to be at 3.9% by the end of the year.
Bloomberg, NEI Investments
Canadian and European economies are closer to rate cuts
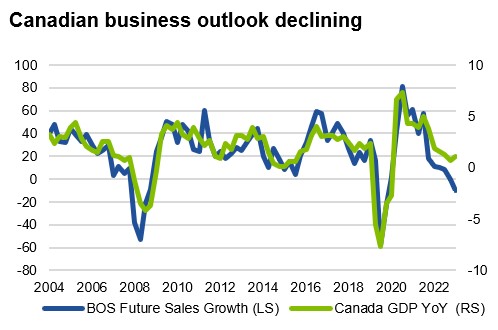
At the same time Canada's economic landscape is undergoing a notable shift, with disinflation emerging as a key trend. The Bank of Canada’s (BoC) latest monetary policy stance reflects this changing inflationary environment. In its recent meeting, the BoC maintained its policy rate at 5%, signaling a dovish shift by removing language that indicated a readiness to hike rates if necessary.
Economic data continues to point towards a slowdown in Canada. The inventories to sales ratio is rising, and business outlook surveys are pessimistic and pointing towards a slowdown. Unlike our southern neighbor, Services PMI Index remains in contractionary territory, similar to the reading in Manufacturing PMI Index.
Source: Bloomberg, NEI Investments
The European Central Bank (ECB) also kept interest rates unchanged and indicated that the first rate cut is most likely in the summer.
Bottomline: Normalization of monetary policy is rooted in the declining trajectory of core inflation. The key question for investors is whether the normalization happens in the context of a resilient economy or in a recession, which leads to very different paths for asset prices.
The outlook in the U.S. remains optimistic. Positive real wage growth and a strong labour market are supportive of consumer spending and GDP growth. It could, however, feed into renewed inflationary pressure hence impacts the Fed’s ability to cut rates. With the S&P 500 Index making new highs and priced to perfection, the potential downside could be higher if the Fed cannot deliver on the anticipated rate cuts.
In Canada, we believe the economy may experience a more significant pullback than the BoC is expecting. Slowing economic growth coupled with easing core inflation may allow the BoC to cut rates sooner.
Magnificent 4 driving S&P 500 to new high
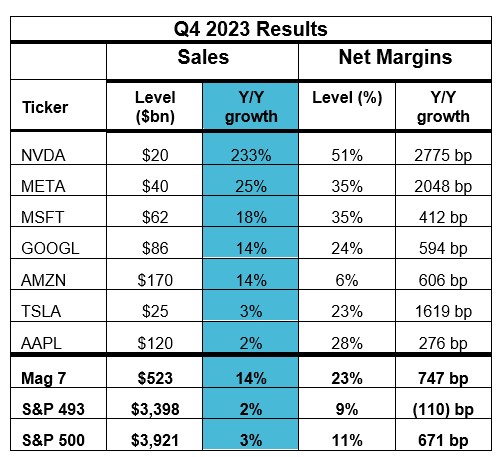
Bullish sentiment continued in January, helping the S&P 500 index reach a new record with the megacap names driving most of the gains. The recent earnings reports point to an extremely narrow market, with “Magnificent 4” (Nvidia, Apple, Microsoft and Alphabet), being responsible for the majority of returns in the fourth quarter of 2023, magnifying concerns about these companies moving into euphoria territory.
A closer look at the dispersion between these companies’ earnings growth prospects vs. the rest of the market helps to explain the performance gap. Mega cap tech broadly beat consensus 4Q revenue estimates with an average positive surprise of 1.3%. The seven companies in “Magnificent 7” generated $523 billion in sales during 4Q, representing a year-over-year increase of 14%. Revenue growth for the remaining 493 companies in the index was a comparatively meager 2%. Margins for the “Magnificent 7” expanded by nearly 750 bp year-over-year to 23% vs. a 110 bp contraction to 9% for the remaining 493 companies in the U.S. Index
Source: Bloomberg, NEI Investments
Bottomline: We don’t believe the “Maginficent 7” companies are in bubble territory given their growth characteristics. The narrowness of the market may well persist given their above-market level of growth. However, given the range of industries they represent, it’s more prudent to analyze the growth adjusted valuation of each of the 7 companies to better understand their relative attractiveness to the overall index.
Diverging paths of Asian markets
China has been a notable laggard this year under-performing both developed and emerging markets, while Japan has been the top-performing market.
China’s woes continues
Negative inflation data in China with both consumer and producer prices continuing to contract raised concerns about the economy falling into a deflationary cycle.
Investor sentiment was also darkened by disappointing economic growth data from China. That’s fueled more calls for stimulus measures, with the action taken by authorities so far underwhelming investors including foreign investors who have been hesitant to invest in China due to policy uncertainty.
Japanese stock market supported by depreciating Yen
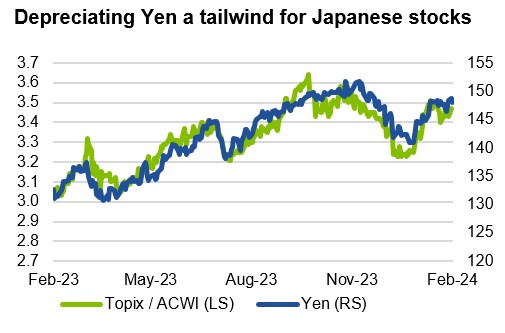
With U.S. yields falling at the end of 2023, Japanese equities underperformed for foreign investors as global equities benefited from falling yields, and the Yen appreciated sharply.
Appreciation of Yen had been weighing on Japanese stocks since early November 2023, but this has turned around in January as U.S. interest rates rebounded. Yen has continued to weaken YTD and Japanese equities have been quickly making up for the underperformance over the last two months of 2023.
Source: Bloomberg, NEI Investments
Bottomline: Japanese stocks are expected to continue performing well in 2024, fueled by a weakening Yen, robust earnings growth, and investor-friendly Tokyo Stock Exchange reforms. However, with the Fed likely to cut interest rates and the BoJ expected to move away from its negative interest rate policy, there remains a notable risk to the downside.
Strong earnings growth provide room for further upside
The S&P index is making new historical highs and valuations are above historical averages, giving investors pause and even long-term investors may question the sustainability of the market strength.
Of the 67% of the companies in the S&P 500 that reported earnings thus far, 75% have reported earnings above consensus estimates, by 3.8% on average, for Q4 of 2023. If the rest of the companies produced similar results, this would be the second consecutive quarter that the index has reported year-over-year growth in earnings, bucking the falling trend in earnings to a road to recovery and growth.
Although consensus estimates tend to be too optimistic at the beginning of the year with negative revisions throughout the year, it can act as a guidepost for market expectations of corporate earnings growth, an important metric for equity valuations. Consensus estimates on earnings for the end of 2024 and 2025 are starting off on a higher note relative to historical trends, indicating a year-over-year earnings growth of 11.5% and 9.6% in 2024 and 2025, respectively. Although economic slowdown is still on the table and could cause a near-term pullback, the strength in corporate earnings growth provide room for more equity upside this year.
Bottomline: The narrow leadership of the markets conceals many companies that are high in quality, low in debt, cashflow generating, and have positive growth. They are much more attractively valued compared to the mega cap giants that dominate headlines. We believe this is a good time for active managers to identify and focus on these companies that can offer a margin of safety and they also tend to do well after peak rates.